Cancer survivors are dying of other things
As cancer treatment improves, more patients survive their primary diagnosis. But cancer survivors carry a high burden of cardiometabolic conditions: diabetes, hypertension, and obesity. These comorbidities may independently drive mortality in ways that aren't addressed by oncology-focused care. Understanding this is critical for survivorship programs, integrated care models, and risk stratification.
10 cycles, 8 notebooks, publication-grade analysis
I pooled 10 NHANES survey cycles (1999-2018) with NCHS linked mortality files, constructing a nationally representative cohort of 51,168 adults including 4,715 cancer survivors. The analysis follows a full epidemiologic pipeline from cohort construction through sensitivity analyses.
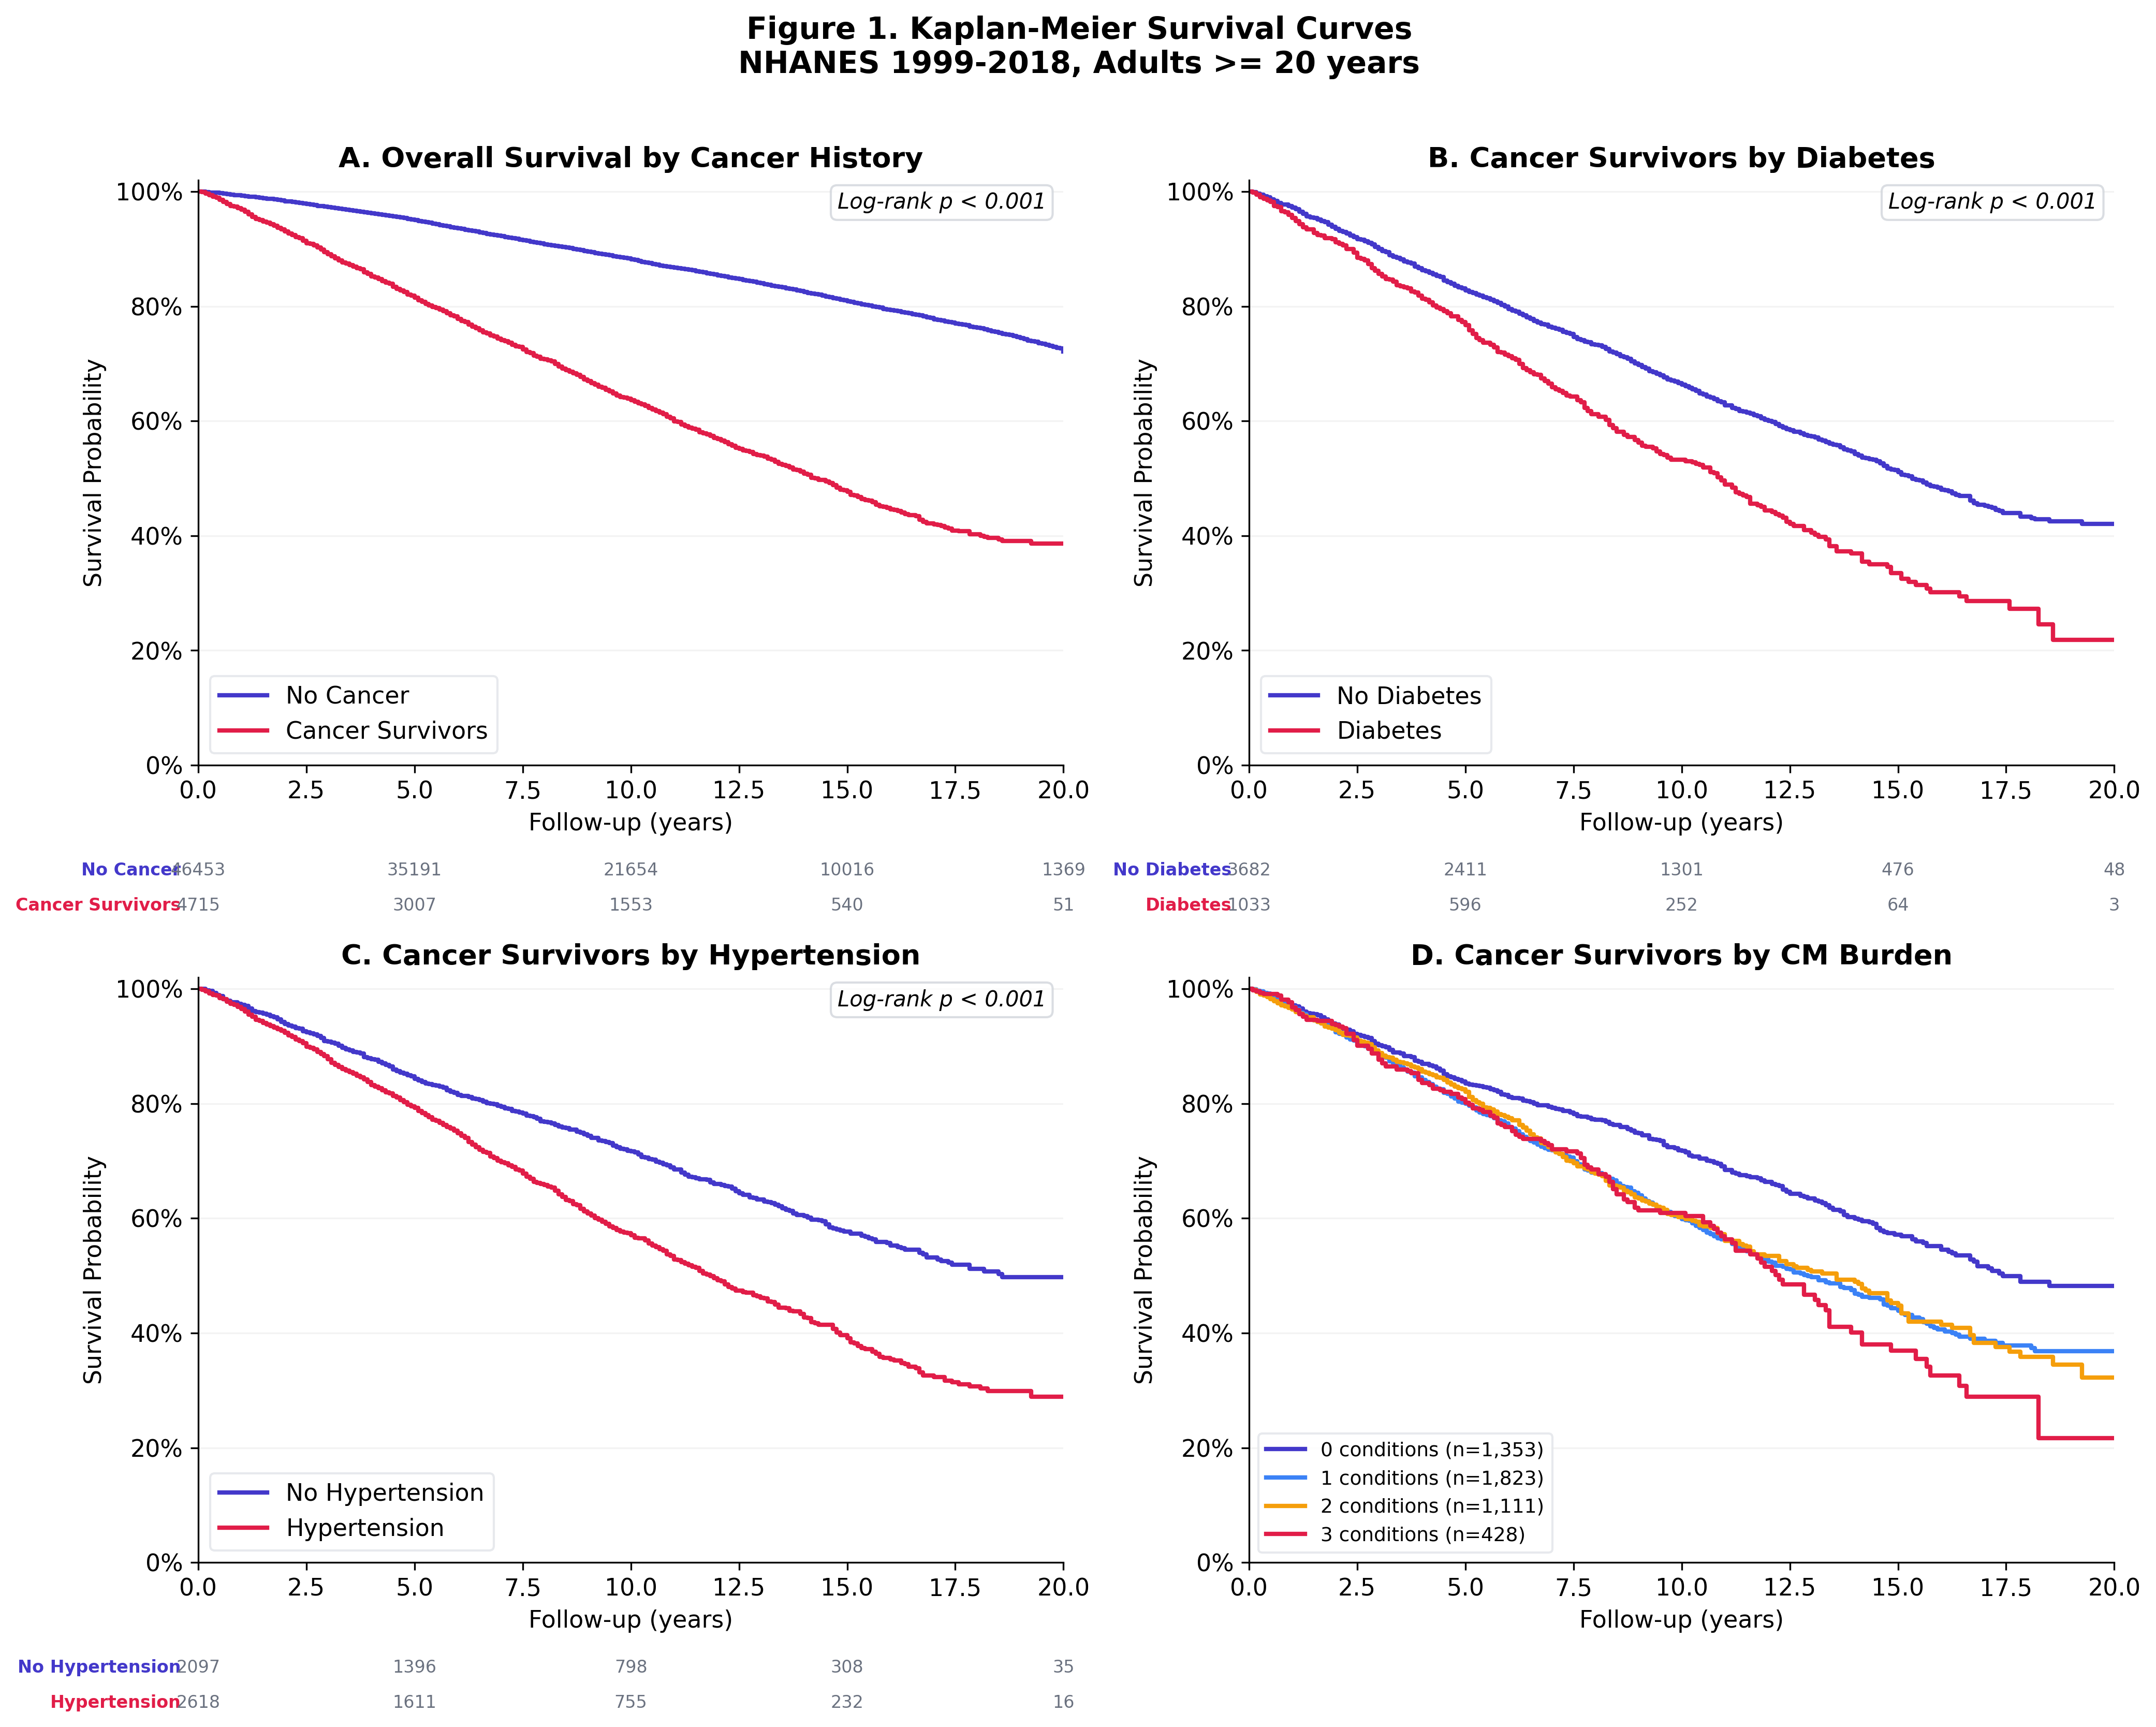
Cancer survivors with diabetes die faster
Kaplan-Meier curves show clear separation in survival between cancer survivors with and without diabetes. The gap widens over follow-up time, consistent with the cumulative cardiovascular toll of uncontrolled glycemia.
Diabetes: HR 1.31 after full adjustment
Progressive Cox regression models show that diabetes remains a significant predictor of mortality even after adjusting for age, sex, race/ethnicity, and smoking. Hypertension is borderline significant. Obesity shows a paradoxical protective effect, consistent with published survivorship literature.
| Comorbidity | Adjusted HR | 95% CI | P |
|---|---|---|---|
| Diabetes | 1.31 | 1.17 - 1.47 | < 0.001 |
| Hypertension | 1.13 | 1.02 - 1.25 | 0.018 |
| Obesity (BMI >= 30) | 0.89 | 0.79 - 0.99 | 0.037 |
| Current smoking | 2.27 | 1.94 - 2.66 | < 0.001 |
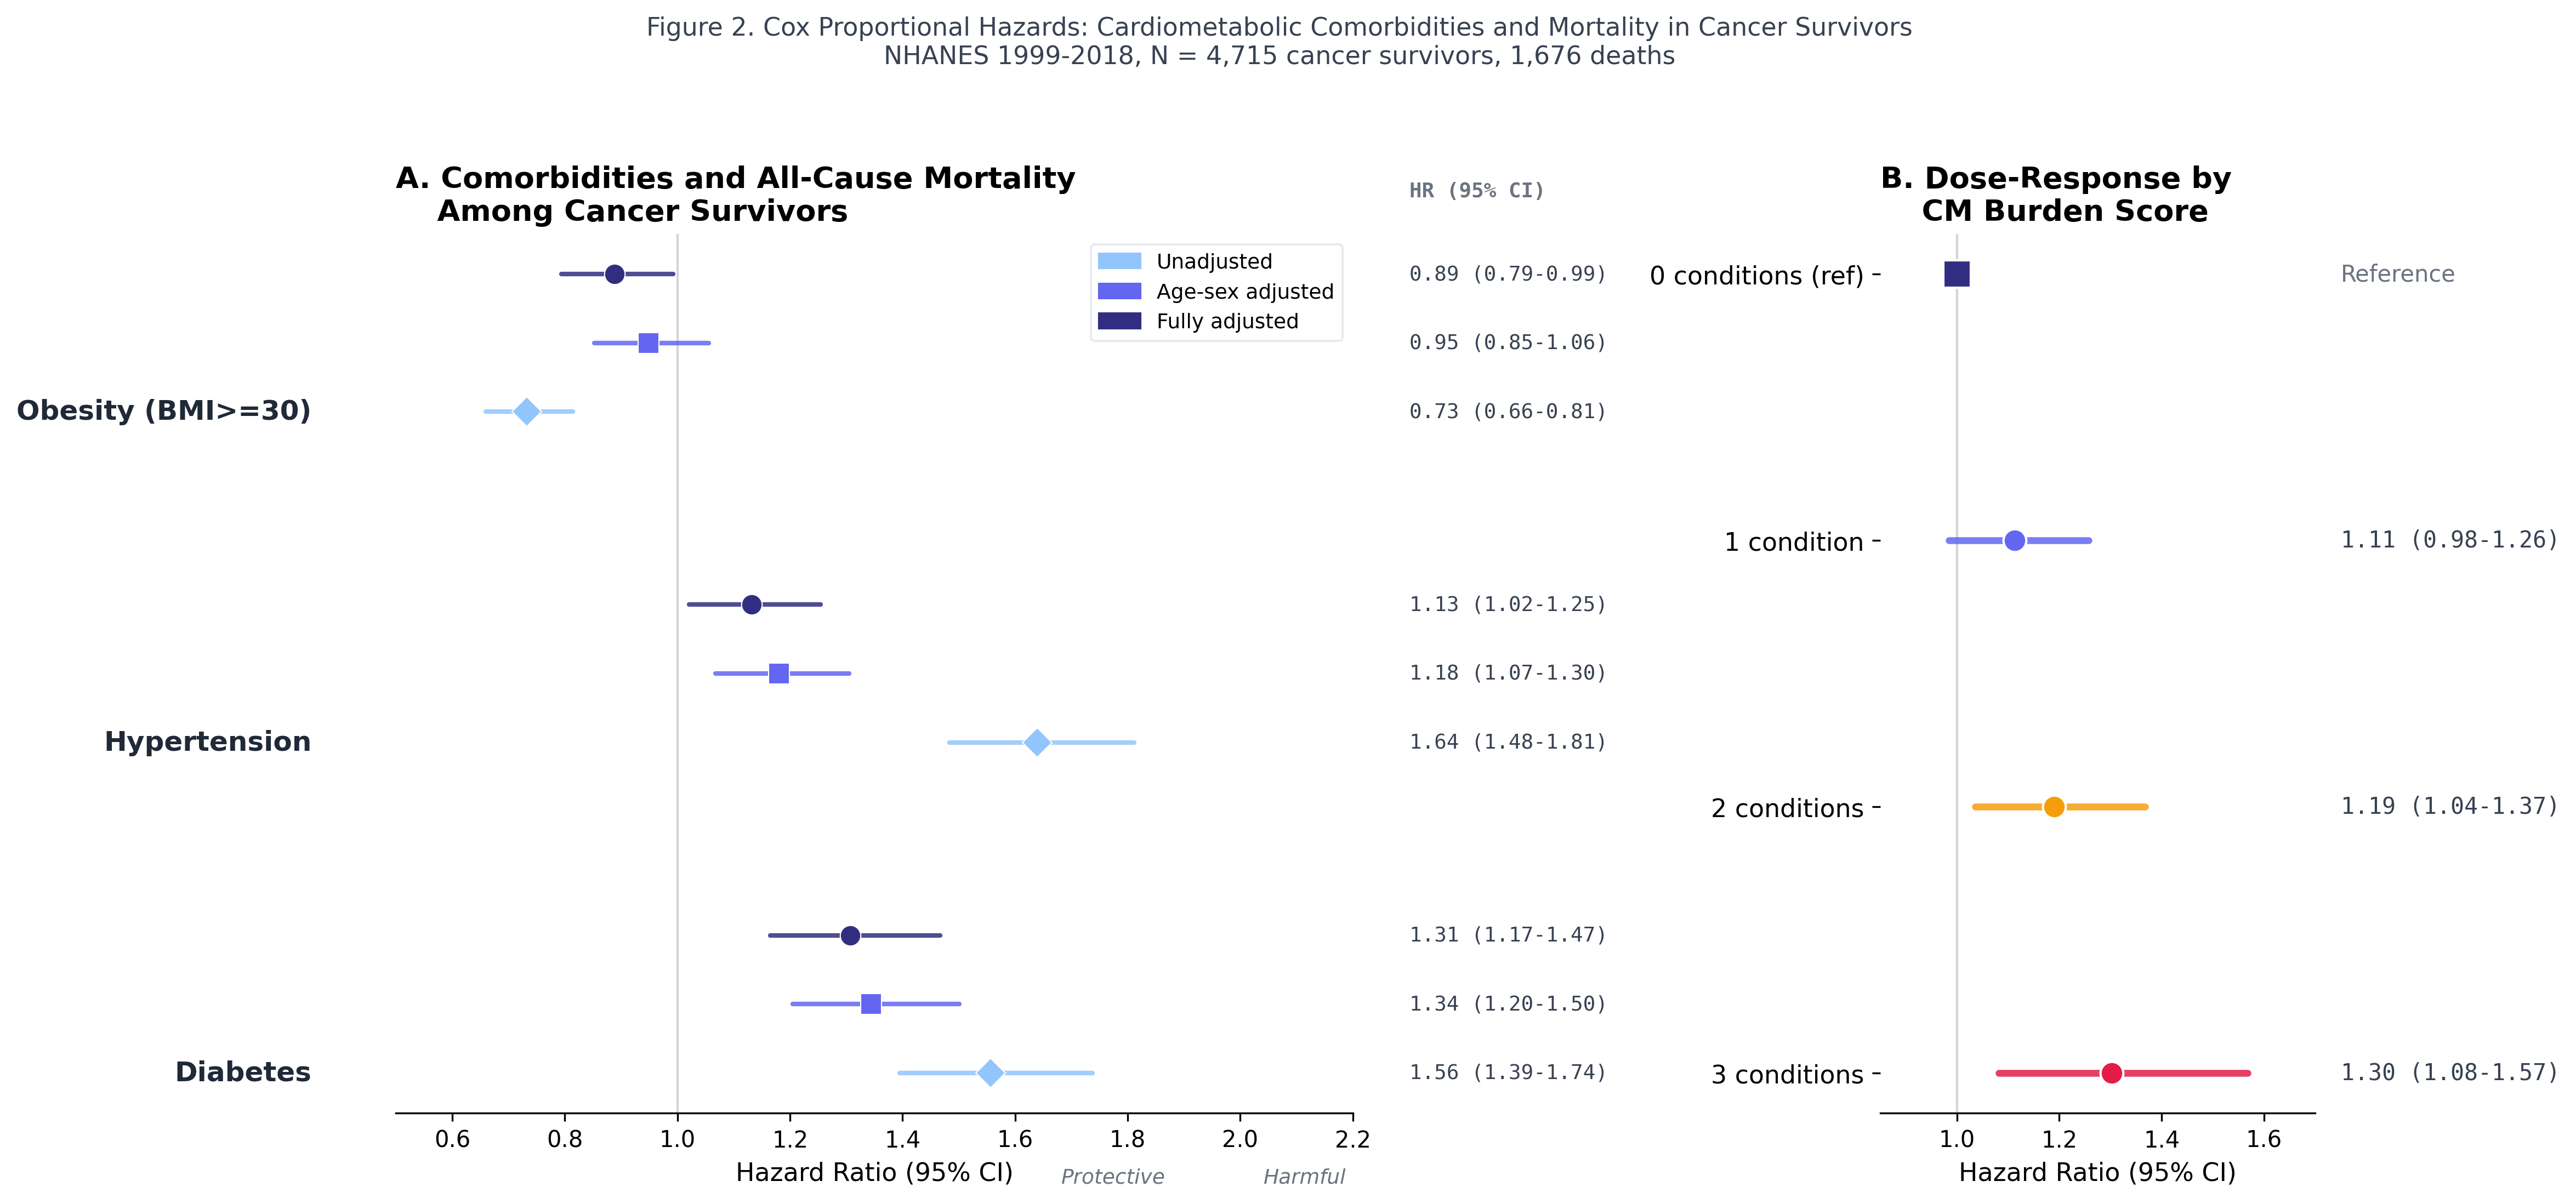
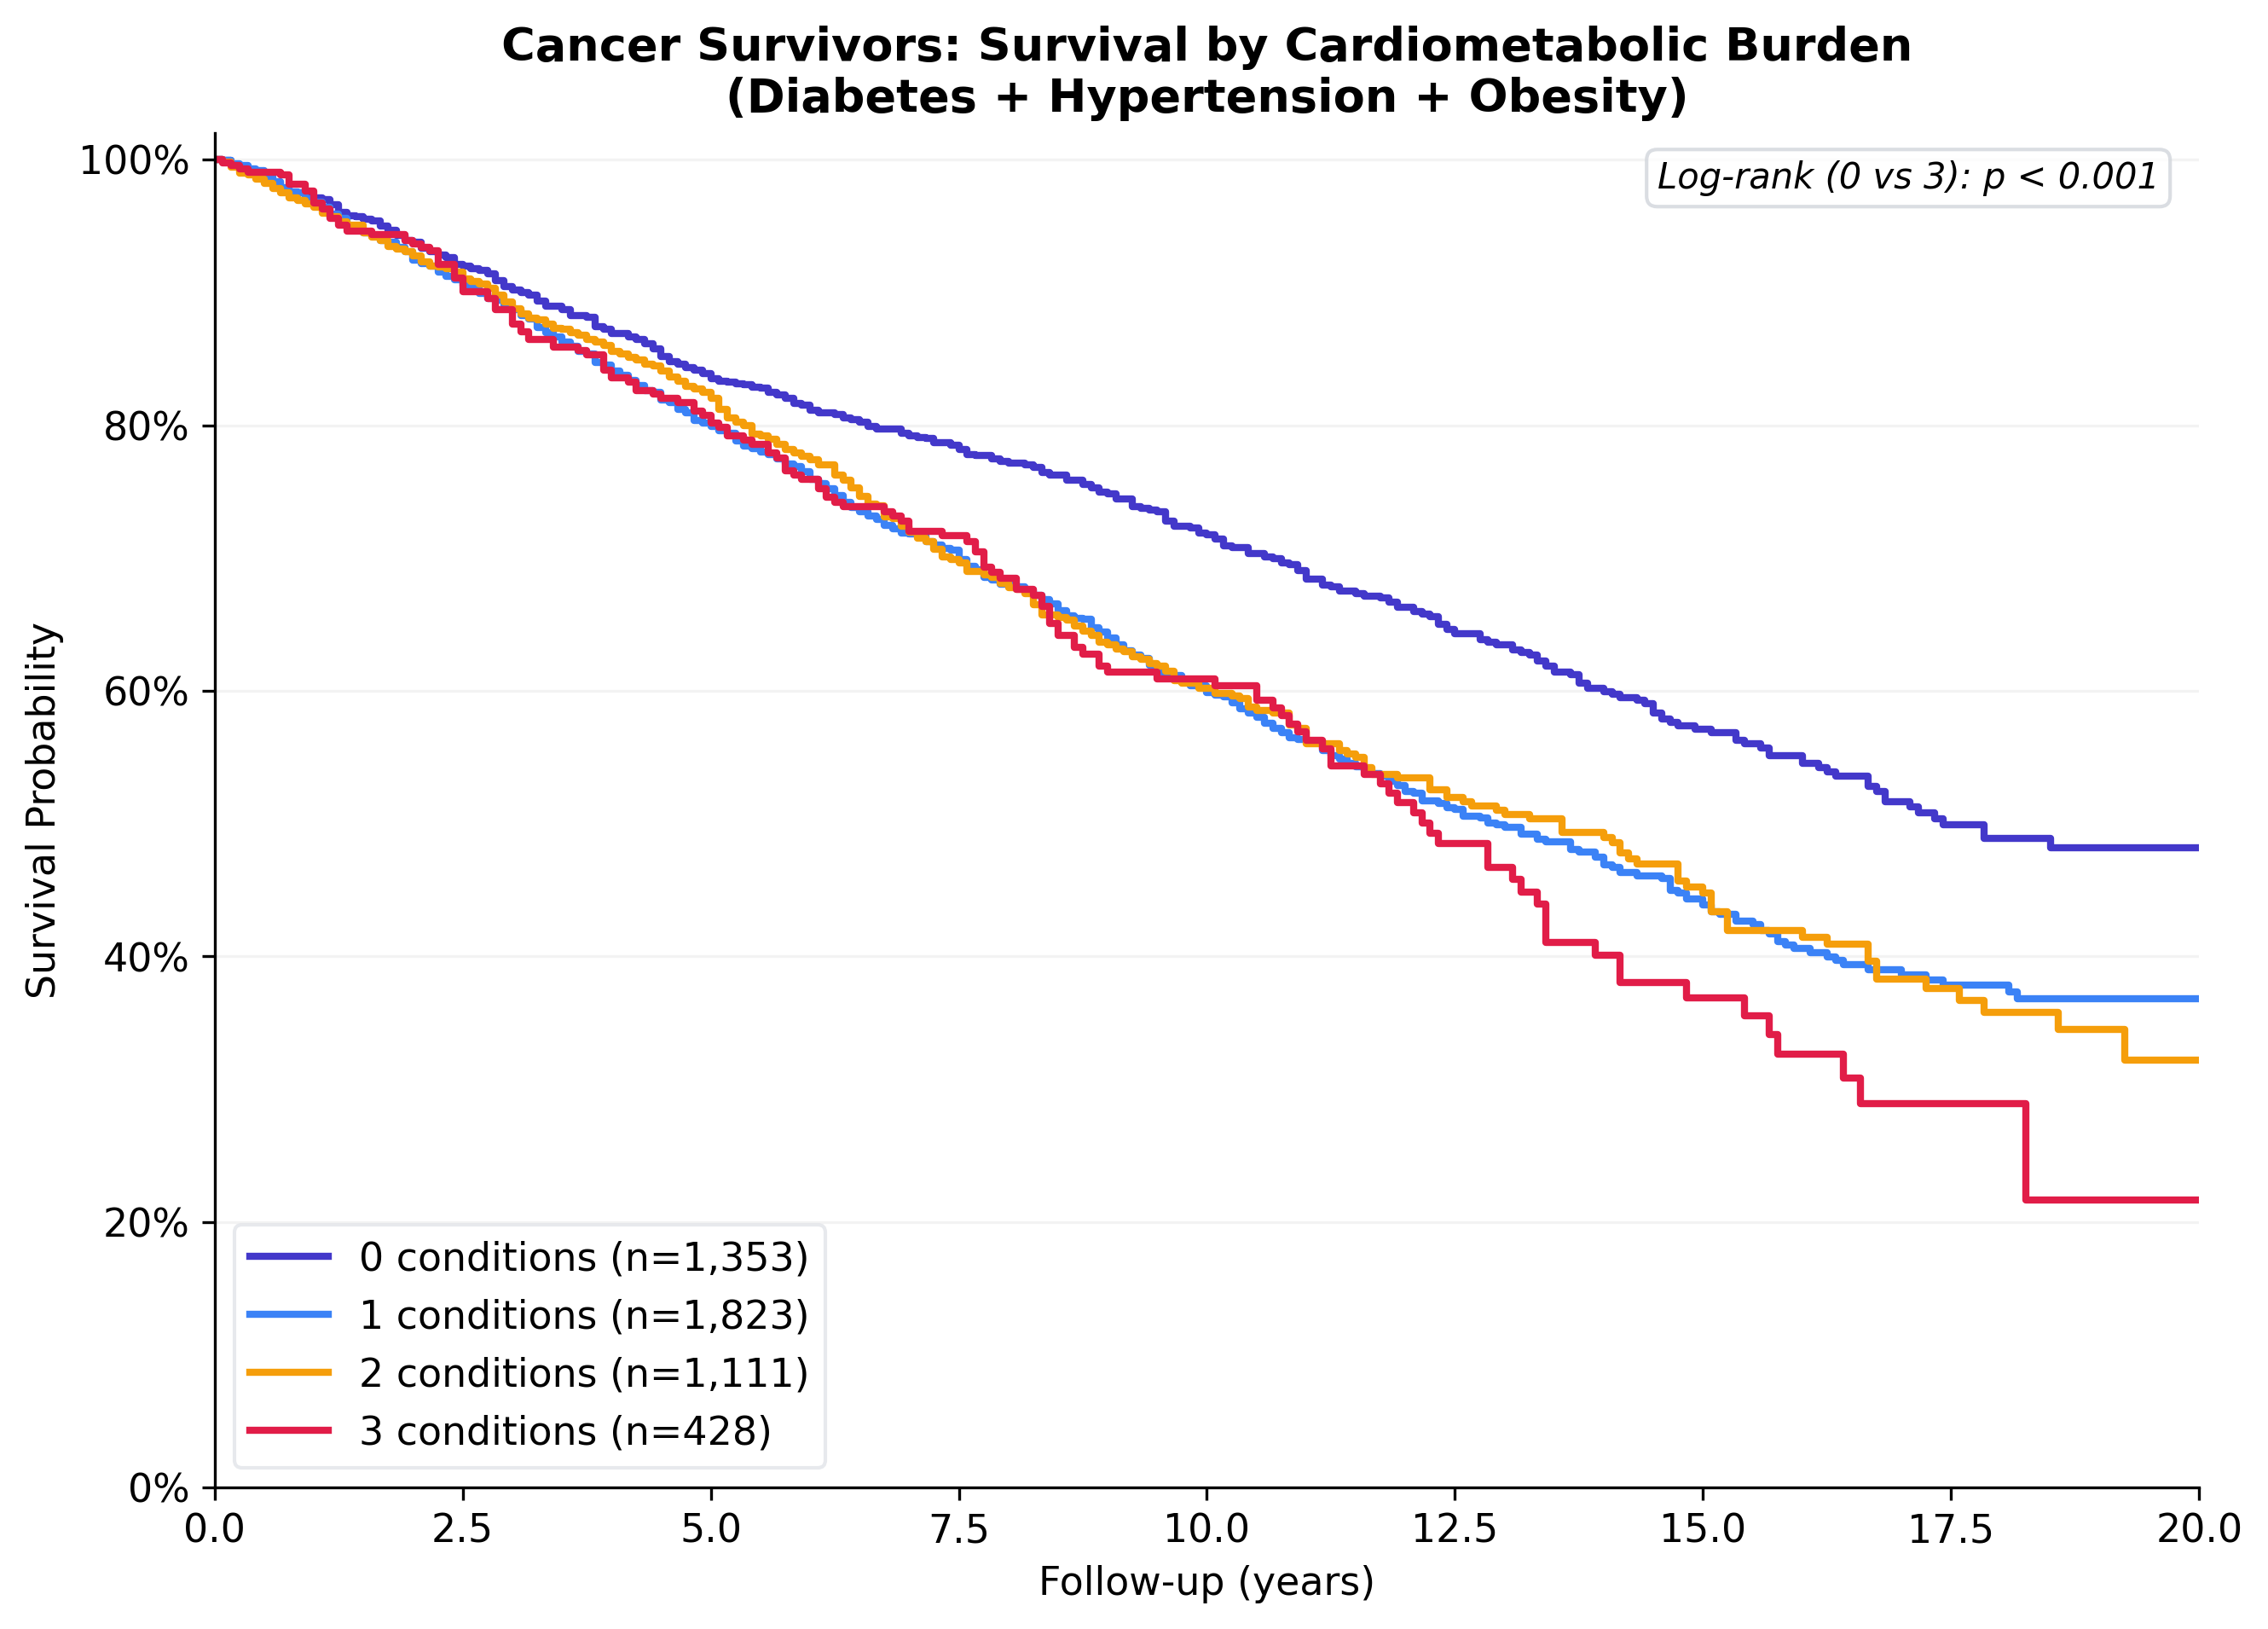
Dose-response: more conditions, higher mortality
Each additional cardiometabolic condition stacks the risk. Cancer survivors with all three conditions (diabetes + hypertension + obesity) have 30% higher mortality than those with none (HR 1.30, 95% CI 1.08-1.57). This dose-response relationship strengthens the causal argument.
| Burden | HR | 95% CI | P |
|---|---|---|---|
| 0 conditions (ref) | 1.00 | -- | -- |
| 1 condition | 1.11 | 0.98 - 1.26 | 0.088 |
| 2 conditions | 1.19 | 1.04 - 1.37 | 0.014 |
| 3 conditions | 1.30 | 1.08 - 1.57 | 0.005 |
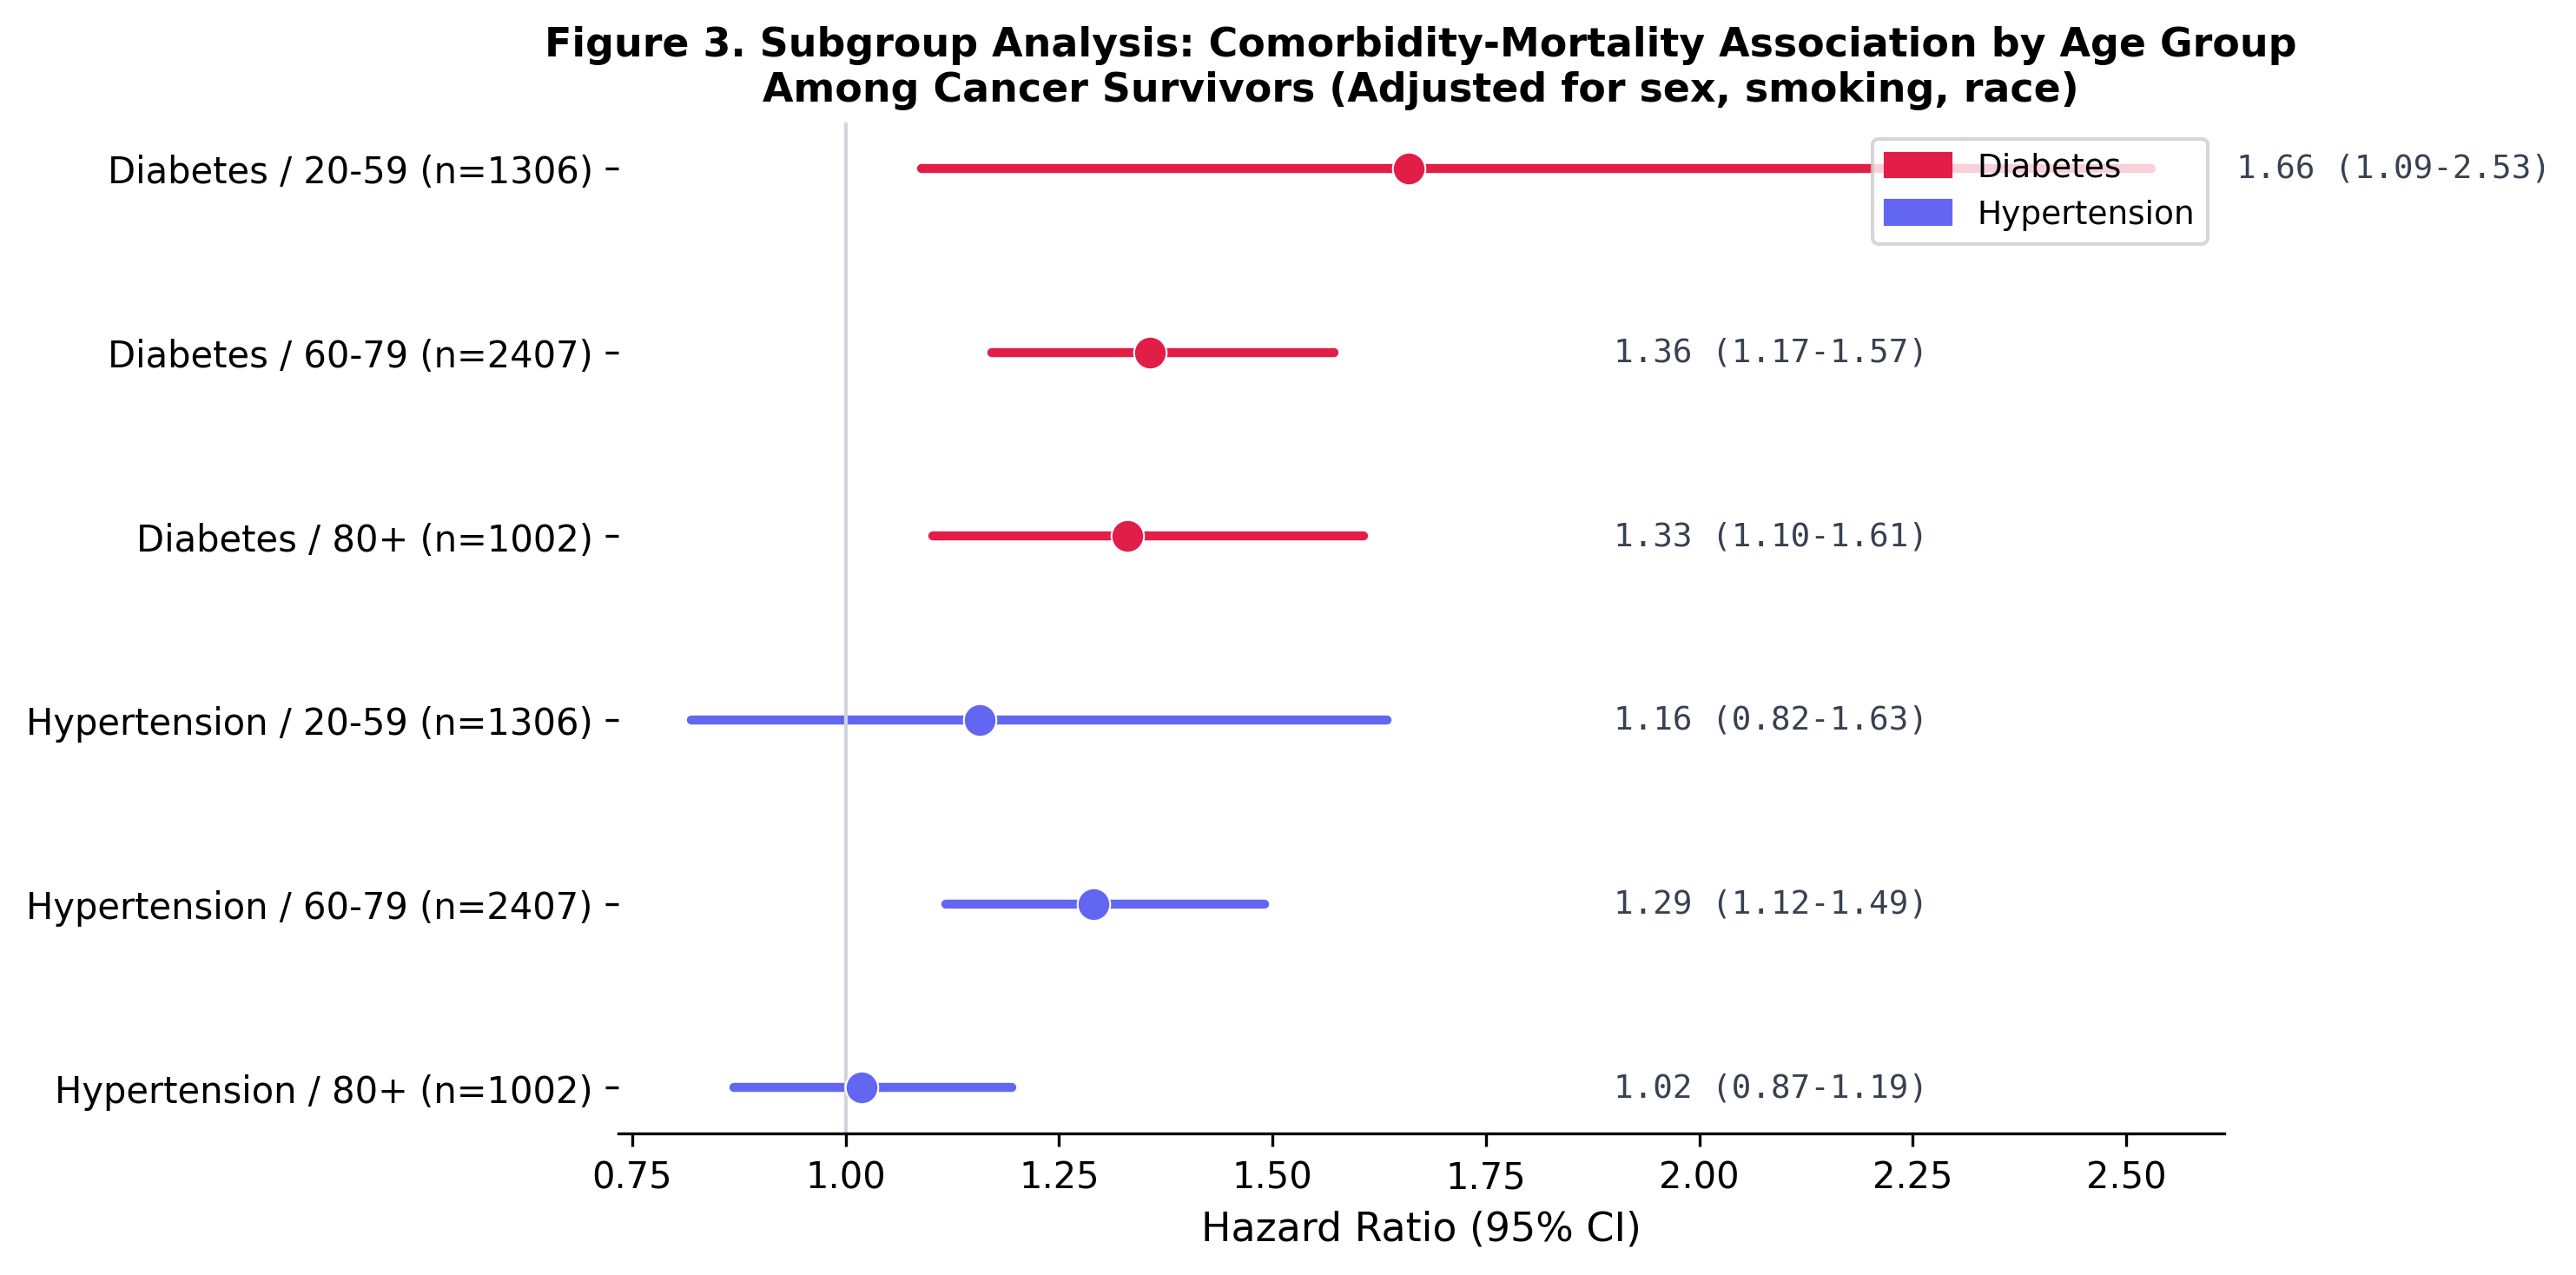
Diabetes hits younger survivors hardest
Subgroup analysis reveals that the diabetes-mortality association is strongest among younger cancer survivors (age 20-59: HR 1.66) and attenuates with age (60-79: HR 1.36, 80+: HR 1.33). This has direct implications for survivorship screening guidelines.
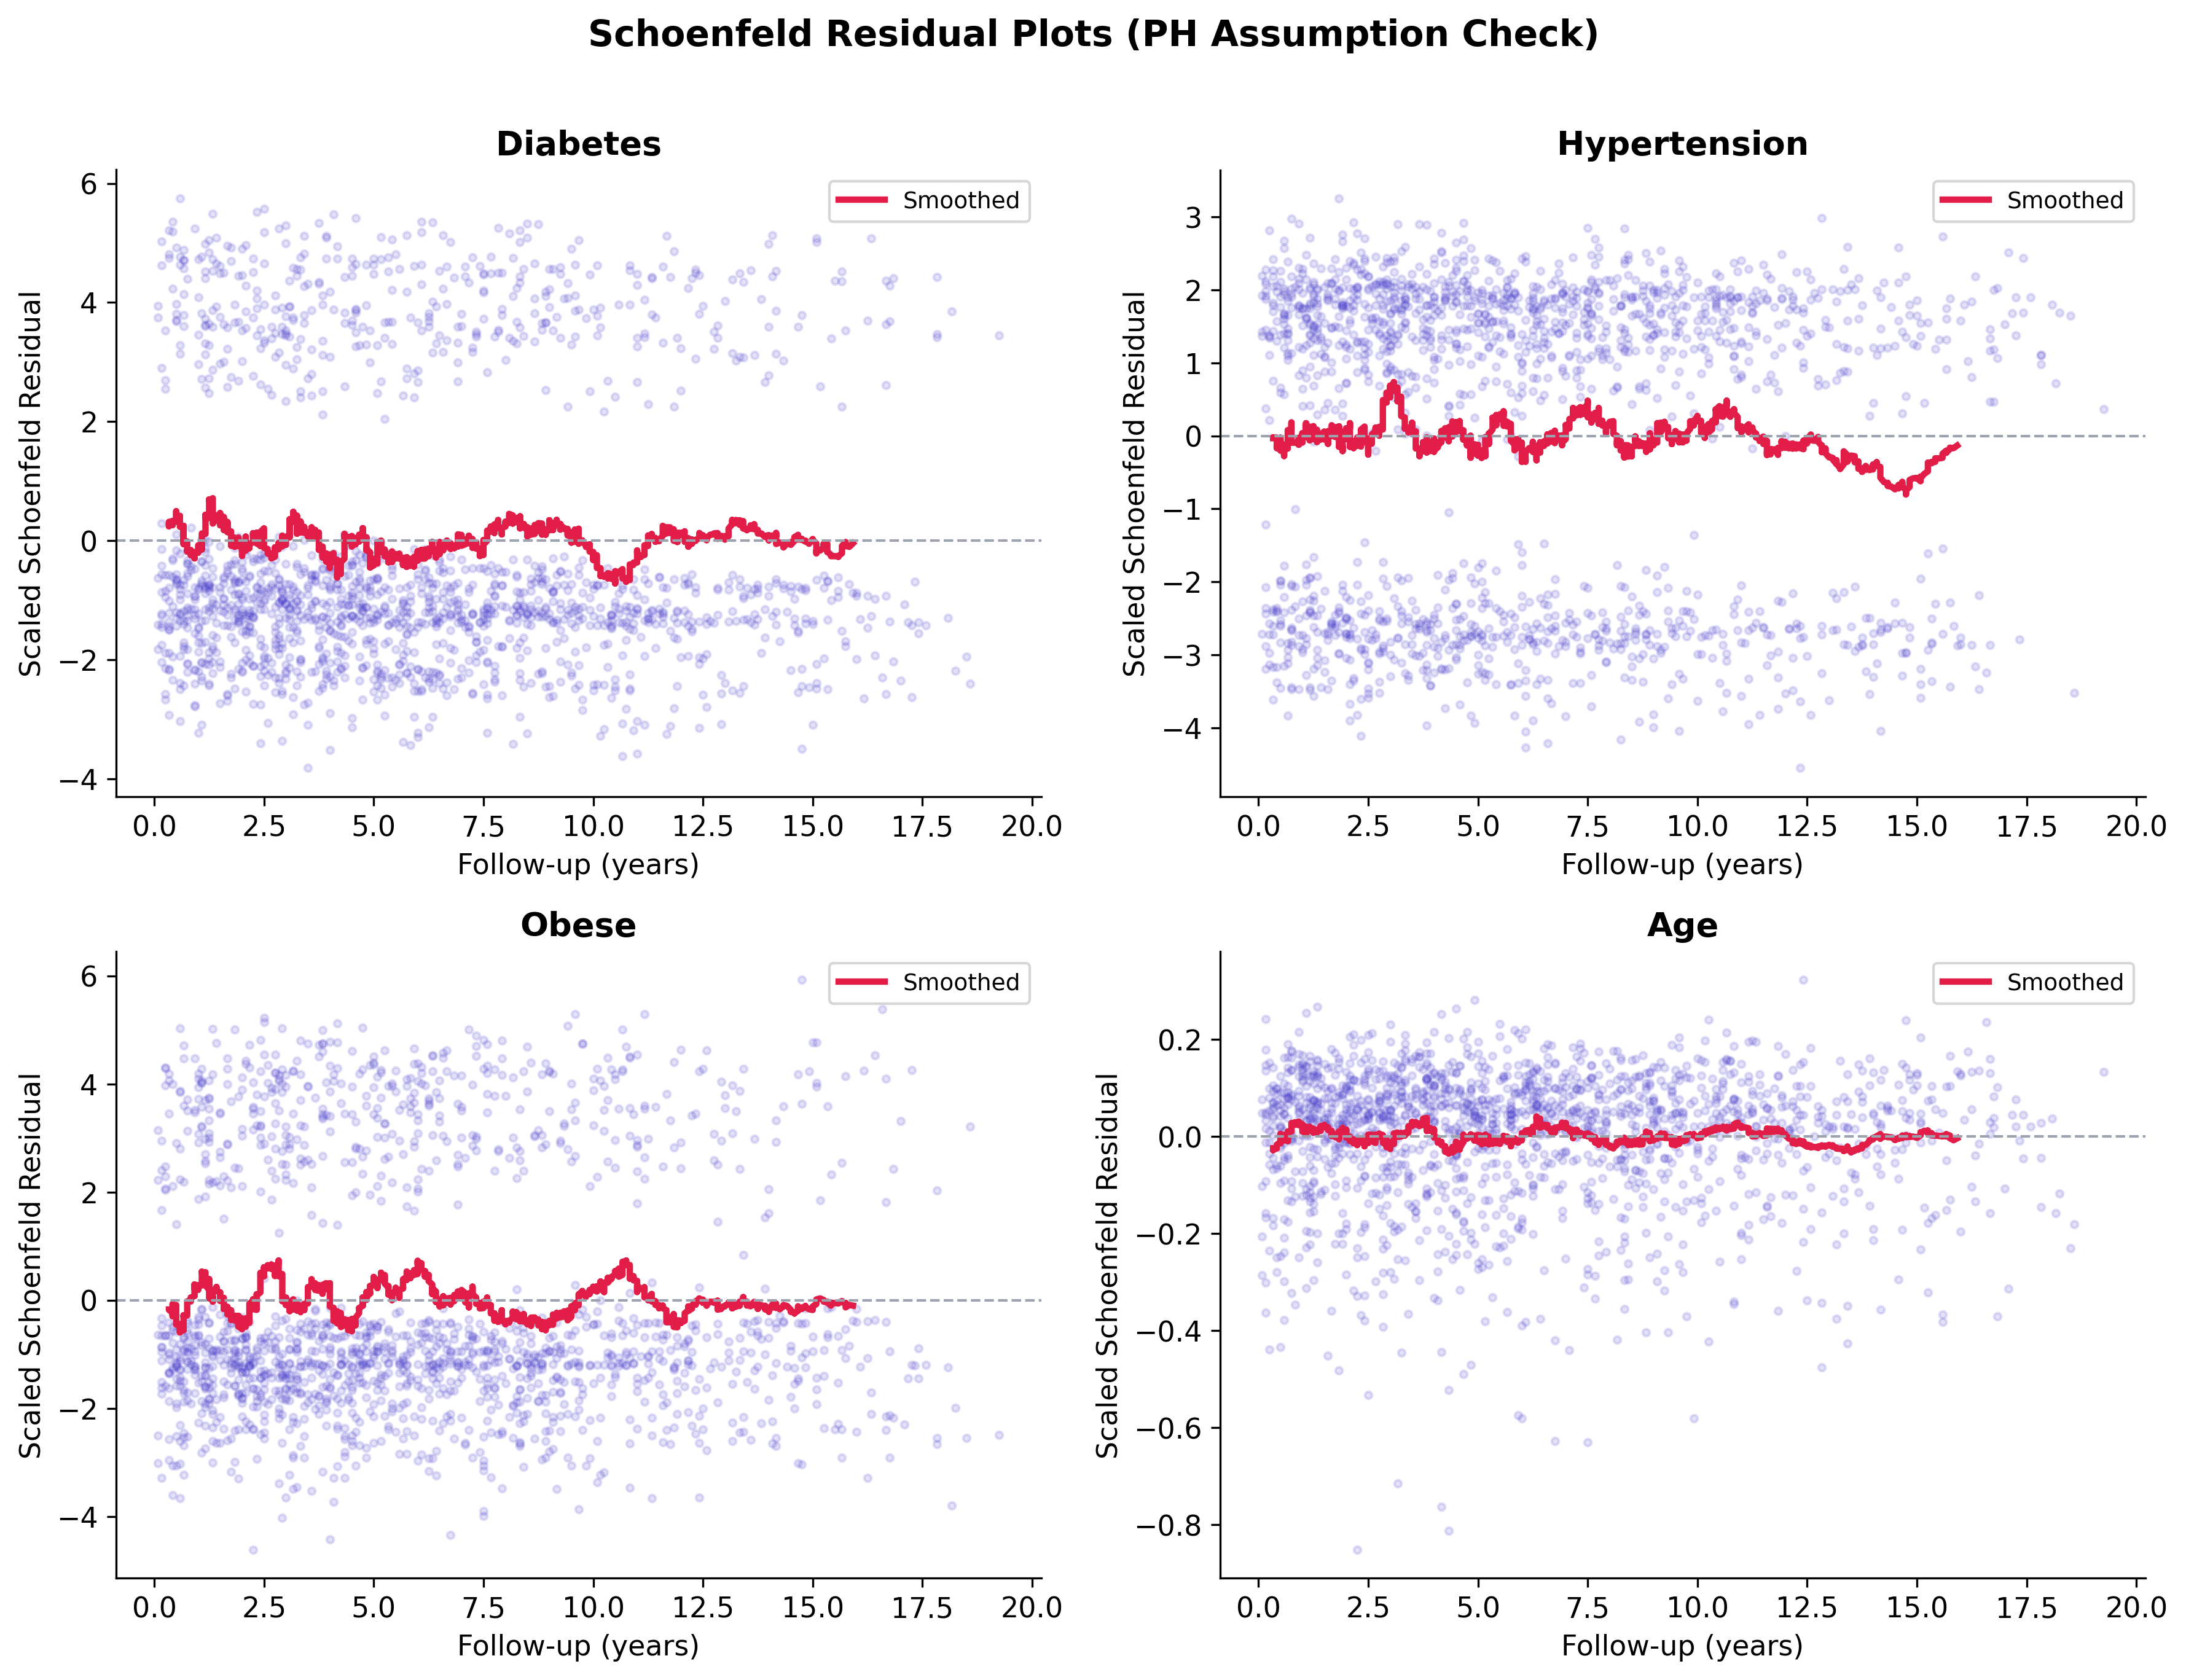
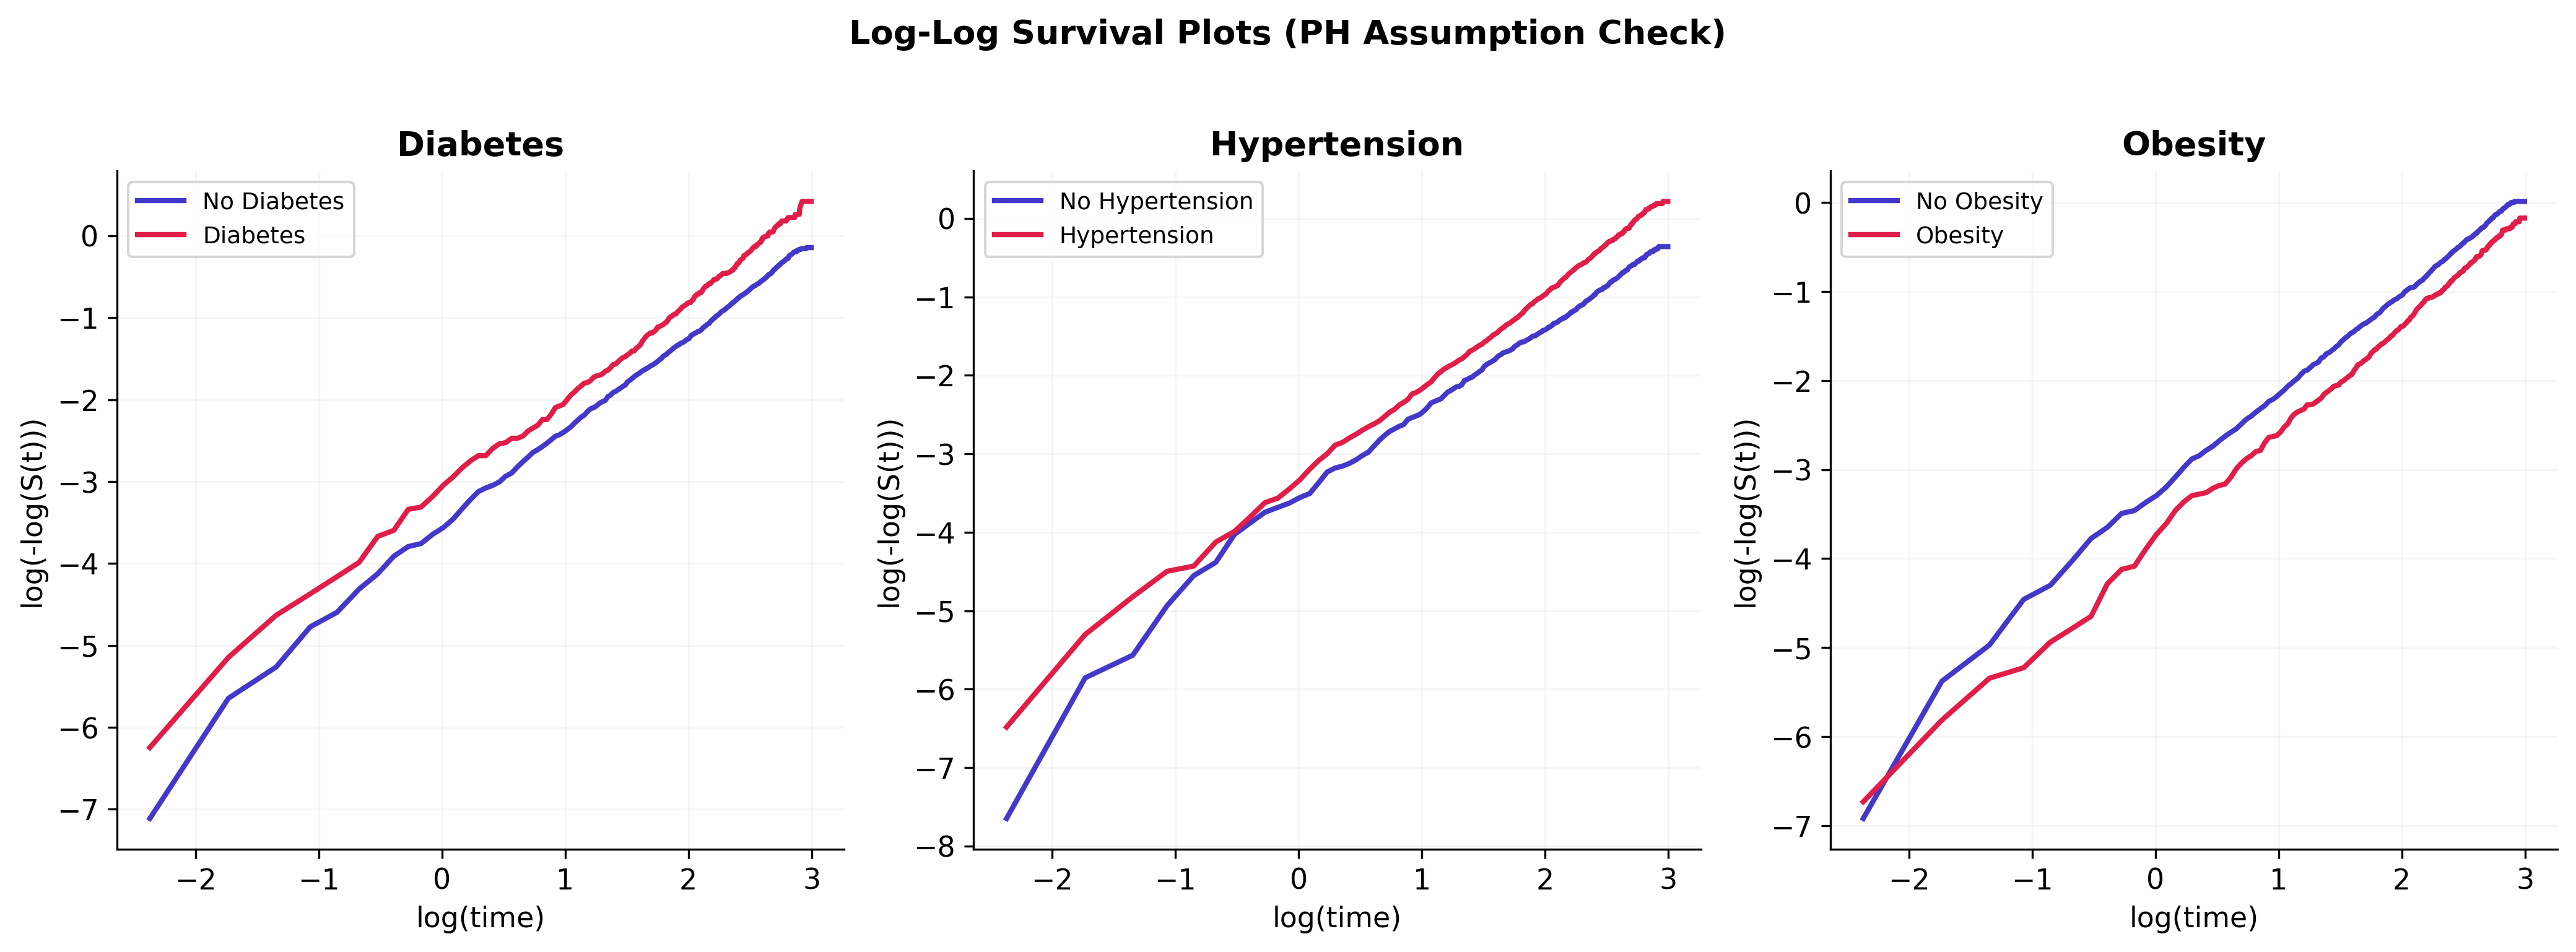
PH assumption: mostly met, mild violations flagged
Schoenfeld residual tests support the proportional hazards assumption for the primary exposures of interest (diabetes, hypertension, smoking). Mild violations are present for age and obesity, which is unsurprising given that both effects evolve non-proportionally over a 20-year follow-up window. The diabetes effect estimate is stable across the sensitivity analyses below, so the flagged violations are noted rather than rebuilt with time-varying coefficients in this version.
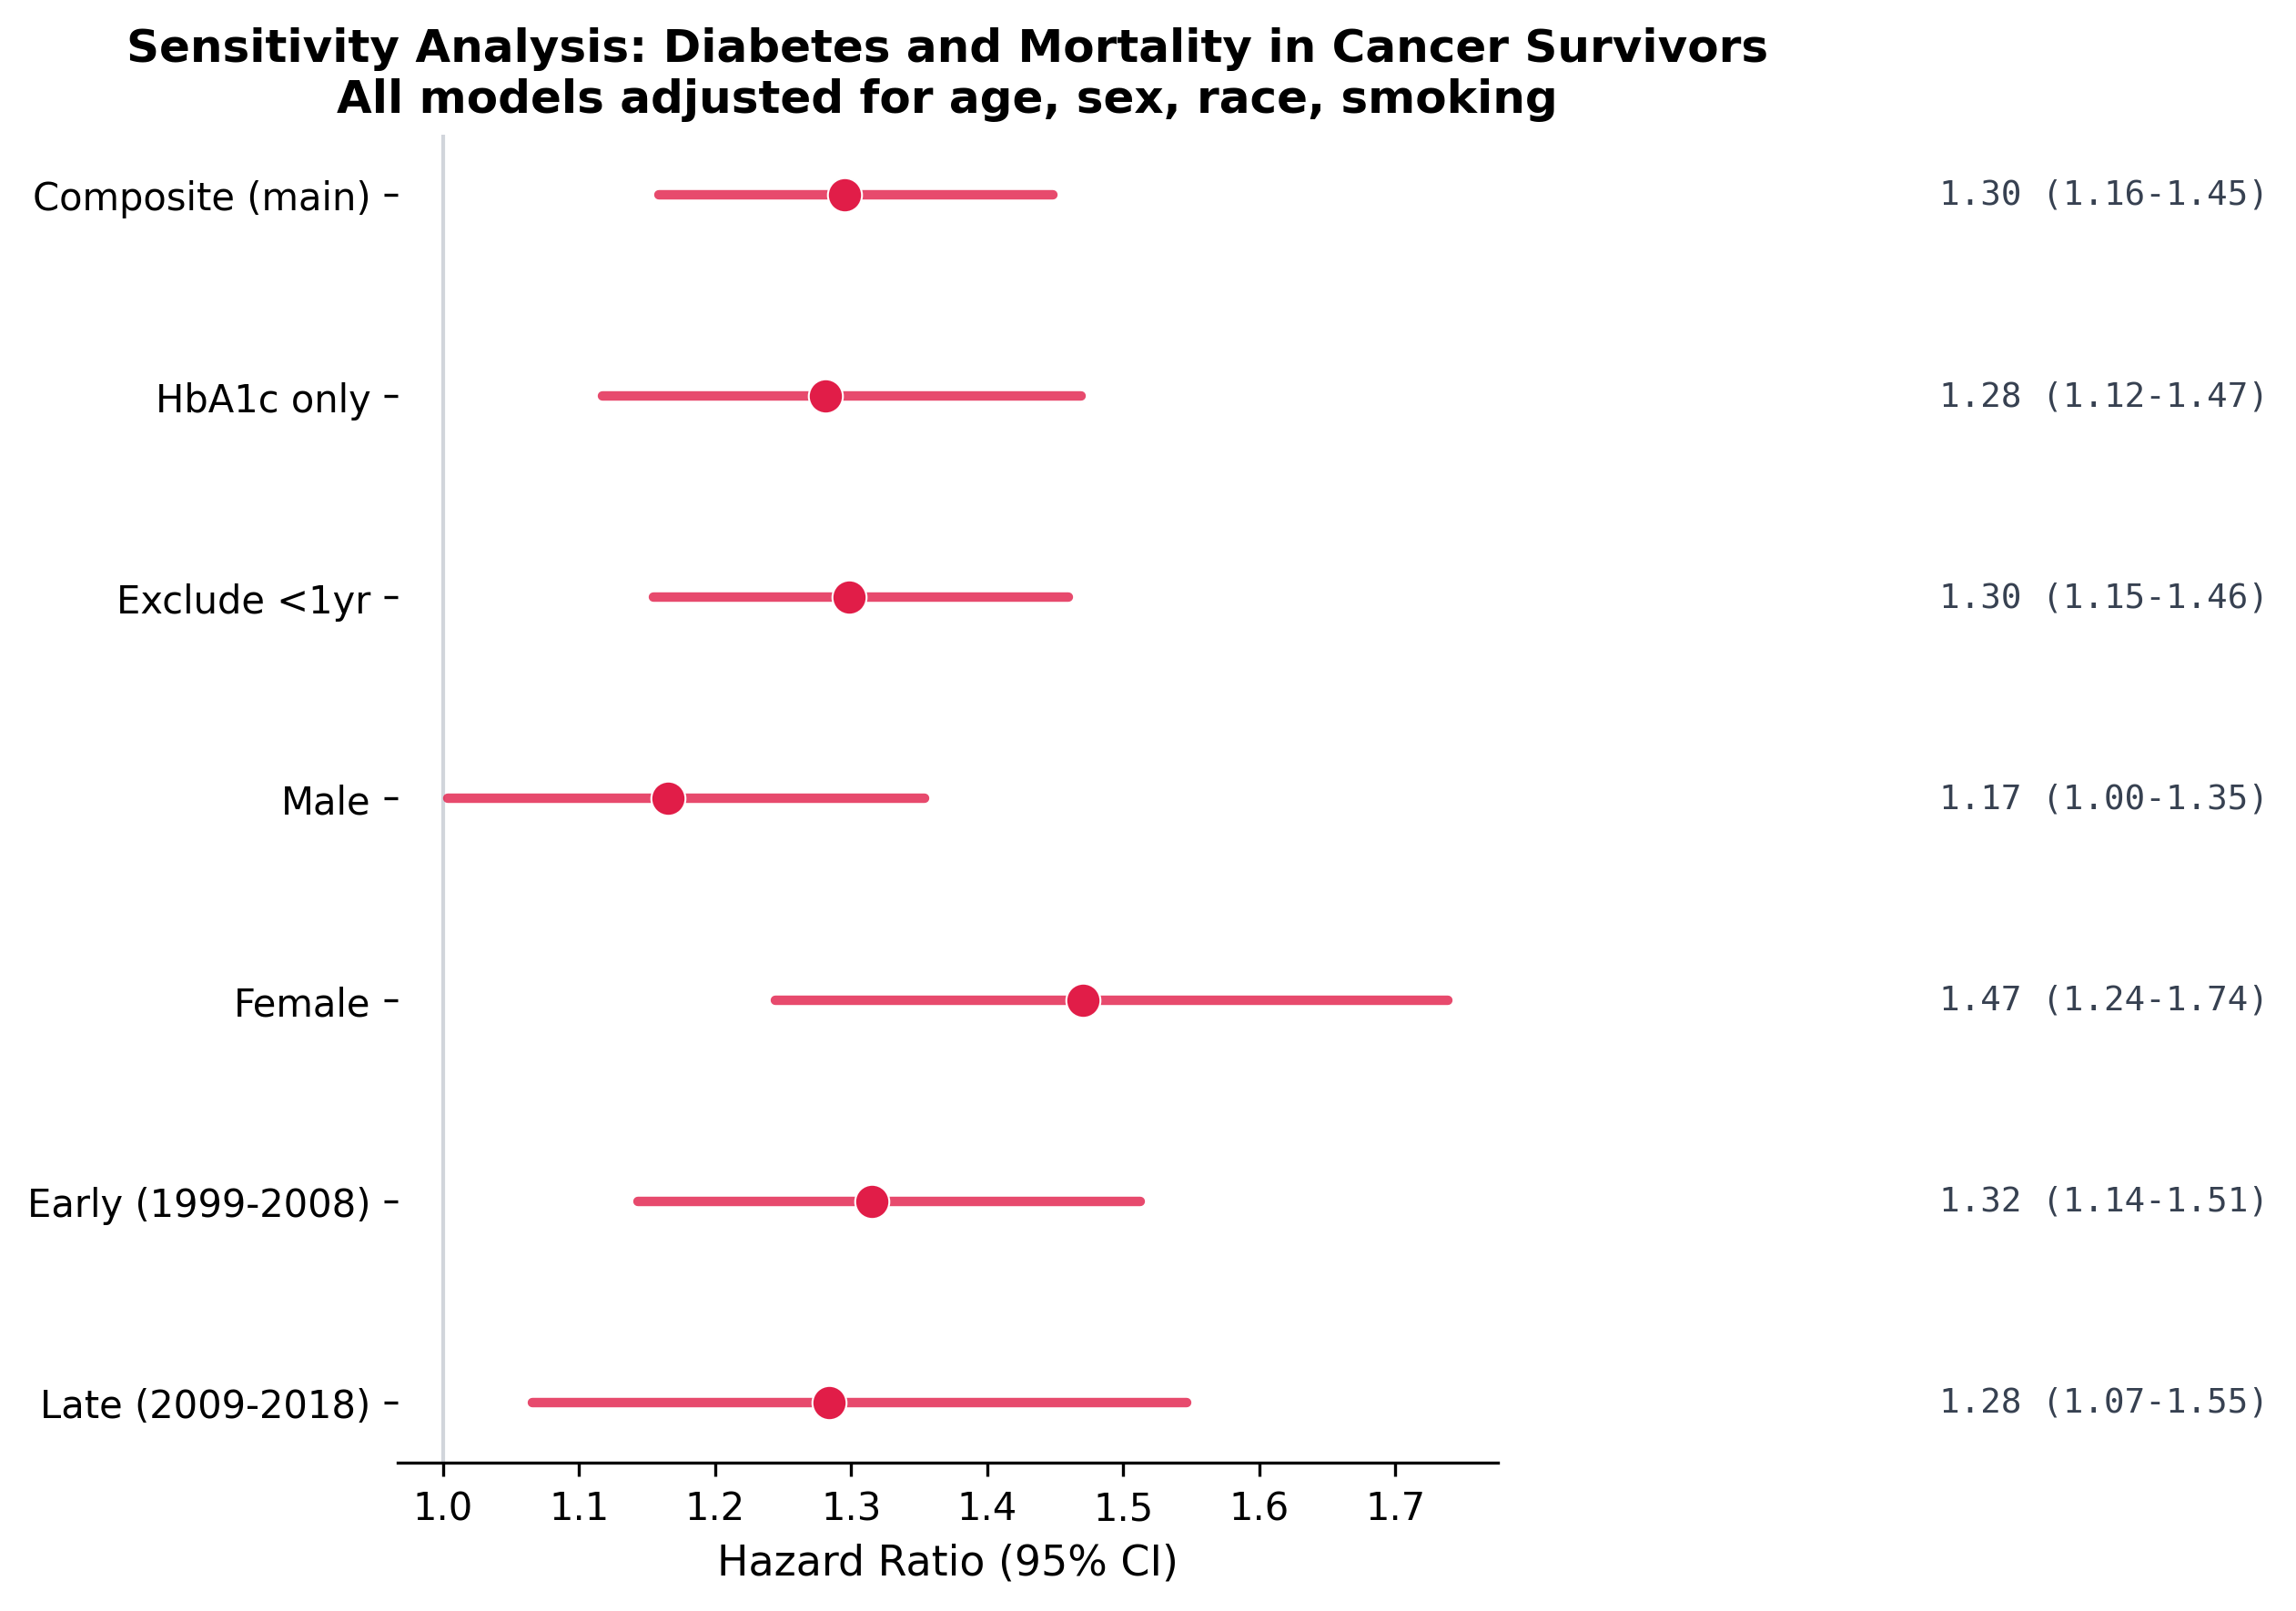
Robust across sensitivity analyses
The diabetes-mortality association persists across every sensitivity test: alternative diabetes definitions (HbA1c-only), exclusion of early deaths (first 2 years), sex-stratified models, and time-period stratification. This consistency strengthens confidence in the primary finding.
Clinical and strategic implications
| Finding | Implication |
|---|---|
| Diabetes HR 1.31, independent of cancer | Survivorship programs should integrate glycemic management alongside tumor surveillance |
| Dose-response with comorbidity burden | Risk stratification models for cancer survivors should include cardiometabolic conditions, not just cancer stage |
| Strongest in younger survivors (HR 1.66) | Early-onset diabetes screening should be prioritized in younger cancer survivor populations |
| Obesity paradox (HR 0.89) | BMI alone is a poor risk marker in cancer survivors; body composition or sarcopenia measures may be more informative |
| Current smoking HR 2.27 | Smoking cessation remains the single highest-yield intervention in survivorship care |
How I built this
Pooled 10 NHANES cycles (1999-2018) by merging 7 survey components per cycle (demographics, cancer history, diabetes, body measures, blood pressure, smoking, HbA1c) with fixed-width mortality linkage files. Custom parser handles concatenated follow-up fields in the mortality data. Cancer defined as self-reported physician diagnosis (MCQ220). Diabetes defined as composite: physician diagnosis OR HbA1c >= 6.5%. Cox models with progressive adjustment (unadjusted, age-sex, fully adjusted). Schoenfeld residuals for PH diagnostics. 8 notebooks, 16 publication-quality figures.
Built with
Cox proportional hazards in Python using lifelines. Raw NHANES XPT files, NCHS mortality linkage, PH diagnostics, sensitivity analyses. Reproducible from the raw data.
Interested in cancer epidemiology, real-world evidence, or survivorship research?
Get in touch